作者:Shiqi Wang, Simon L. Klemperer
文章类型
- 解决具体问题
摘要
We discriminate(区分) upper-mantle earthquakes from crustal earthquakes based on the amplitude ratio of seismic waves Sn and Lg (‘Sn/Lg’), a prominent(突出的) feature of regional seismograms that is visible to the naked eye. Crucially, our new method uses only the waveforms of the candidate earthquake, unlike previous methods to identify upper-mantle earthquakes that introduce potentially large errors by comparing hypocentral(震源定位) depths with independent measures of crustal thickness. Our synthetics show that the Love-wave higher modes that form individual Sn and Lg Airy phases on the transverse component are preferentially excited when the source is respectively below or above the Moho(本文的重要依据,莫霍面上下的地震会分别生成两种不同的波). We use three previously recognized mantle events from southern Tibet to validate our new approach and show that focal mechanism, intrinsic attenuation, geometrical spreading etc., can be ignored to first order. We then identify two new upper-mantle earthquakes in NW Tibet where, previously, only lower-crustal events had been reliably demonstrated, thereby showing this NW-Tibet lithosphere is seismogenic at all depths i.e. that upper-mantle and lower-crustal earthquakes co-exist. Our method has potential for expanding the global catalog of continental earthquakes reliably determined to be close above or close below the Moho.
1.Introduction
-
总结:
Earthquakes require brittle deformation(脆性形变) thereby (因此)providing crucial constraints on mechanical properties of the lithosphere. In intraplate continental(板内大陆) settings, almost all earthquakes occur in the brittle upper crust, but a few nucleate(有核的,指震源?) far deeper, close to the Moho, as reported across diverse tectonic(构造的) settings for over 40 yrs.The modal interpretations of Lg and Sn inspire them new discriminant.
-
要点:
-
Limitations of previous studies on sub-Moho earthquake
Old Way: Almost all previously attempted discriminations between crustal and mantle near-Moho earthquakes have relied on two independent analyses, the separate determination of focal depth and of Moho depth,which are only as accurate as the seismic wavespeed models used(reasonable variations in the wavespeed model can produce a change in focal depth of >20 km for near-Moho earthquakes)
In summary, no reliable and flexible method has yet been available to distinguish lower-crustal from upper-mantle earthquakes that are close to the Moho.
-
Modal interpretations of Lg and Sn inspire our new discriminant
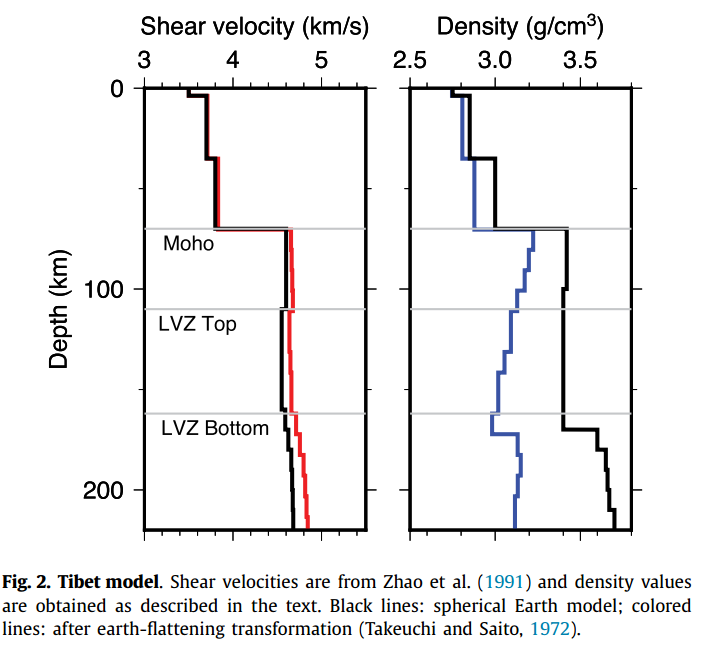
Lg波:Lg (on the transverse(横向的) component) is a superposition(叠加) of higher-mode Love waves and composed of large-amplitude ‘Airy phases’ associated with stationary (固定的)points on Love-wave group-velocity dispersion curves, whose horizontal group velocities (hereafter(此后) simply group velocities) fall within the conventional 3.1–3.6 km/s range of Lg, and whose horizontal phase velocities (hereafter simply phase velocities) approximately equal the lower-crust shear-wave velocity.The displacement eigenfunctions(特征函数) associated with these Airy phases show the Lg phase is mainly confined within the crust,indicating that the whole crust is acting as a waveguide for Lg. Another lithospheric waveguide exists between the free-surface and the top of the low-velocity zone (LVZ).
Name:The Sn and Lg waveguide theory.
-
Structure of the paper
-
We first present theory and numerical simulations of highfrequency Sn and Lg and their ratio, Sn/Lg, for earthquakes above and below the Moho in realistic earth models
-
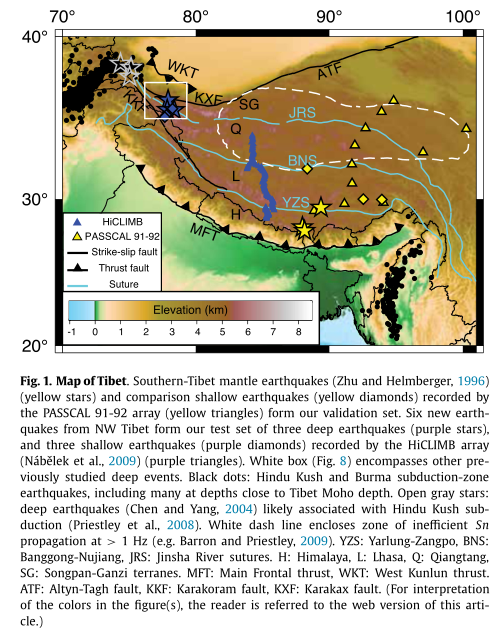
then discuss propagation(传播) effects on Sn and Lg amplitudes on real data.We examine 12 events in Tibet. Six are previously-studied earthquakes from southern Tibet, three crustal and three upper-mantle.To demonstrate the validity of our synthetics and the ability of Sn/Lg to discriminate whether each event is above or below the Moho
-
-
-
图片:
2.Theoretical basis
-
总结:
For a source with an arbitrary moment tensor(任意矩张量) (Mij) and measured at azimuthal(方位角的) angle φ and distance r, the far-field Love-wave spectrum(远场勒夫波谱) is
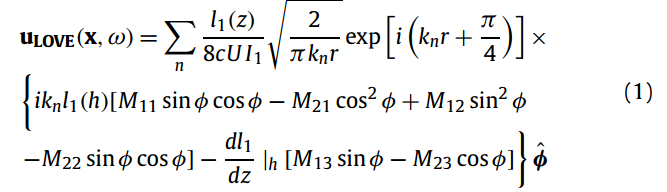
Where n is the mode number; c and U are horizontal phase and group velocities; k is the horizontal wavenumber; I1 is an energy integral; ω is angular frequency; h is source depth (Aki and Richards, 2002). (l1 (z), μ(z) dl1 dz ) is the eigenvector(特征向量) of the Lovewave eigenproblem which we will solve numerically, below.
-
要点:
-
Sources with no M13 and M23 dependence (i.e. dip-slip(倾向滑动) on a 45◦-dipping fault and strike-slip on a vertical fault), the Love-wave amplitude spectrum is directly proportional(成比例的) to the displacement eigenfunction l1(h)
-
Seems to imply that the measured amplitude spectrum is proportional to l1(z) at the observation depth, which is normally at the surface z = 0. However, since the eigenvector is the solution of a homogeneous(均匀的) set of equations and boundary conditions, it is only uniquely determined up to a constant multiple, which gives us the freedom to use different constants to normalize the eigenvector regardless of mode number or frequency。
-
As a result, Eq. (1) predicts no site effects for our 1D model, although such effects are expected in real data. Likewise, we have not included the ubiquitous(普遍存在的) propagation effects of geometrical spreading(几何扩散) and intrinsic attenuation(本征衰减)
-
3.Numerical validation(数值验证)
-
总结:
We use the Generalized Eigenproblem Spectral Collocation (GESC) algorithm (Denolle et al, 2012) to solve the Love-wave eigenproblem (Eq. S2). The boundary conditions are automatically satisfied by replacing appropriate rows of the discretized eigenfunctions, resulting in a generalized eigenvalue problem.
-
要点:
-
Love wave normal modes(Fig.3)
Shows examples why we expect a larger Sn/Lg for subMoho earthquakes than for crustal earthquakes.
Lg is preferentially excited by crustal earthquakes. Only those Lg Airy phases associated with the group-velocity minimum at low mode numbers (Knopoff et al, 1973) have any significant amplitude below the Moho,These Lg Airy phases cease(停止) being excited once the source is sufficiently deep (Fig. S3-3c, d)
However, the dominant eigenfunction amplitudes for Sn always occur below the Moho, there must exist a threshold for Sn/Lg that only sub-Moho earthquakes can exceed, which should be observable by examining multiple stations and comparing closely-located earthquakes.
-
Synthetic seismograms(Fig.4)
These synthetics allow us to isolate and investigate the effect on Sn/Lg of facal depth and azimuthal angle for both dup- and oblique(斜的)-slip sources, and demonstrate there should be an observable signature(信号) in field observations, subject to path effects that we next discuss
-
-
图片:

图片说明:Lg and Sn Airy phases. Each row shows dispersion curves (频散曲线)(left column) for a randomly selected mode, and displacement- and strain-eigenfunction normalized amplitudes at two random example frequencies (A and B) corresponding to Lg and Sn Airy phases (middle and right columns). The eigenfunctions are normalized to the largest displacement, but the ratio of the eigenfunctions at different depths (which defines the eigenvector) is preserved. Gray dashed lines in the dispersion plots indicate a separation of Lg (< 4 km/s) and Sn (> 4 km/s) group/traveling velocities. Phase velocities are indicative of the turning velocity/depth for their corresponding Airy phases.Note that frequency scales vary in left column。
4.Parameterizing Lg and Sn amplitude(参数化两种波的振幅)
-
总结:
Following Hasegawa (1985), we model measured amplitude spectra as

where A is amplitude, S the source term, G the geometricalspreading term, ψ represents intrinsic attenuation, I the known instrument response and R the site response. In our 1D model these parameters only depend on frequency f and epicentral distance r.
We aim to measure Sn/Lg on data that is minimally-processed and without regional-specific corrections. To achieve this goal, we first focus on S and G with conventional models, and later we evaluate the influence of ψ and R in real data.
-
要点:
-
Source term(震源项)
Two relevant aspects of the source term are the amplitude spectrum and radiation pattern. The dependence of the amplitude spectrum on the eigenfunctions (Eq. (1)) is the reason that mantle earthquakes have larger Sn/Lg than crustal events.
We do not attempt to correct focal-mechanism effects in our real data, but instead show we can observe qualitative Sn/Lg distinctions between mantle and crustal earthquakes regardless of their source parameters.
-
Geometrical spreading term(几何拓展项)
Spreading of Lg depends only on distance:

Where γ is the spreading exponent(指数) typically assumed to be 1 (e.g.Yang, 2002), or sometimes 0.5 (e.g. Fan and Lay, 2003). In contrast, Sn spreading is both distance- and frequency-dependent, with a complex form due to Earth’s sphericity(球形):

with r0 = 1 km and ni(f) are fixed parameters for a specific Earth model (Yang et al, 2007).
We cannot directly compare the absolute magnitudes of GLg and GSn as calculated above, since they are obtained with different parametrizations of spectral amplitudes (Eq. (2); Yang, 2002; Yang et al, 2007). Instead we focus on the general trends of these classical models: Log10 GLg always decreases with increasing offset but, using values of ni(f) from Yang et al (2007), Log10 GSn increases almost linearly for r >∼ 500 km (Fig. S5-1), predicting systematically higher Sn/Lg at larger distances for any given event due to geometrical spreading alone. However, this systematic increase does not affect the utility(实用) of Sn/Lg as a discriminant between mantle and crustal earthquakes, because the Sn/Lg ratio originates from the source spectrum (Eq. (1)) and is unaffected by appropriately scaling it with distance. Because regional seismograms are usually recorded with r > 500 km, i.e. in a range where classical models predict linear increase of log10(Sn/Lg) with distance, we empirically detrend our data to remove the effect of geometrical spreading (Fig. S5-2) instead of quantitively correcting it based on empirical models, which would also require introducing regionalspecific parameters.
-
-
图片:

图片说明:Normal-mode synthetics for our Tibet model.:
a. Source and station parameters.
b. Displacement seismograms for events that are far above (z = 12 km) and far below (z = 100 km) the Moho at 70 km depth, calculated with 100 modes, bandpass filtered 1-3.8 Hz, colored cyan (or red) for arrival times corresponding to Lg group velocities, 3.1-3.8 km/s (or Sn, 4.0-4.6 km/s).
c. As b, but for source depths close to the Moho (shown with a blue line). Sn and Lg amplitude ratios are labeled on the right vertical axis. d. Radiation patterns of Sn, Lg and Sn/Lg for two sources at two different depths (multiplied by arbitrary scalars to enable plotting on the same axes; for the 12-km case, a = 20, b = 5; for the 100-km source depths, a = 1, b = 0.1).
5.Data
-
总结:
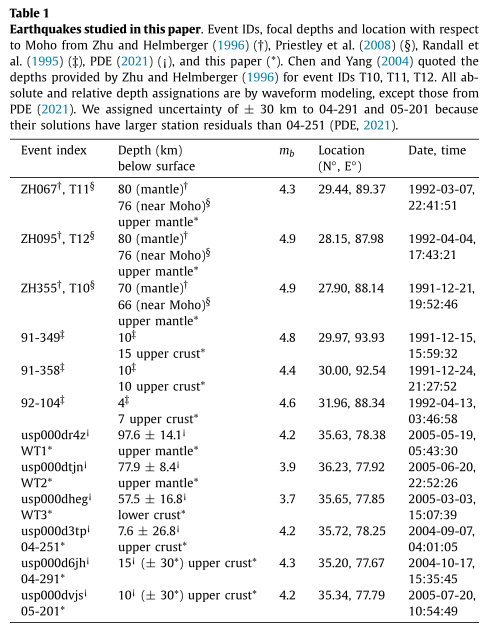
We analyze data from 12 Tibetan earthquakes recorded by temporary arrays on the Tibetan Plateau: the 1991-1992 ‘PASSCAL’ experiment (Owens et al, 1993; McNamara et al, 1995, 1996) and the 2005 ‘HiCLIMB’ array (Nábelek ˇ et al, 2009) (Table 1, Fig. 1). Six events in southern Tibet include three previously identified as subMoho with source depths of 70–80 km (ZH067, ZH095, ZH355 of Zhu and Helmberger, 1996) (Fig. 5) and three comparison events with depth ≤ 15 km (91-349, 91-358, 92-104 of Randall et al, 1995) (Figs. 5, S6, S7-1). The three comparison events are the closest earthquakes to the ZH sub-crustal events that were recorded by the same stations and that have shallow focal depths constrained by waveform fitting (Randall et al, 1995; Supplementary Materials S6). Six events in north-western Tibet recorded by HiCLIMB (PDE Bulletin, 2021) include three intermediate-depth (albeit poorly located) events, here named WT (West Tibet) 1, 2 and 3 (Fig. 6), and three nearby upper-crustal (≤ 15 km) events recorded by the same HiCLIMB stations (04-251, 04-291, 05-201: Table 1, Figs. 6, S7-2).
We downloaded data from IRIS DMC (Incorporated Research Institutions for Seismology Data Management Center) for all PASSCAL and HiCLIMB stations on the plateau that recorded each earthquake (Fig. 1). We removed instrument response to obtain displacement seismograms and applied an 8-pole Butterworth 1–5 Hz filter. To focus on Love waves, we use only transverse data. We calculate signal-to-noise ratio (SNR) as the ratio of the RMS amplitudes of the Sn and Lg windows (defined based on their groupvelocity ranges as reported from regional studies in Tibet, 4.3
4.8 km/s for Sn (McNamara et al, 1995); 3.13.6 km/s for Lg (McNamara et al, 1996)) to the RMS of a 20 s-long noise window that ends 5 s before the predicted Pn arrival times (Fig. S8-1). Only when SNRs for both Sn and Lg are greater than 4 is a trace considered further. Our Sn and Lg windows are based on published epicentral location and origin time, with an added zero-offset time (cf. Barron and Priestley, 2009) based on a simple crustal model designed to capture the maximum possible time range of Sn and Lg arrivals whether earthquakes originate in the crust or mantle (Supplementary Materials S8). -
要点:
-
Validation events,southern Tibet
On our raypath maps (Fig. 5 left) our color-scale highlights Sn/Lg = 2 as a heuristic(启发式的) boundary separating crustal from mantle earthquakes. The ZH events have a mantle character (Sn/Lg > 2) except where the raypaths traverse(穿过) the well-known region of inefficient Sn propagation (Ni and Barazangi, 1983; McNamara et al, 1995; Barron and Priestley, 2009) that is likely due to partial melt in the uppermost mantle beneath the Quaternary volcanic province of northern Tibet (e.g. Yakovlev et al, 2019). In contrast, our comparison upper-crustal events are never recorded with a mantle character (Figs. 5, S7-1)
Sn and Lg waveforms and Sn/Lg ratios from the ZH events and from the upper-crustal events are categorically(绝对的) different in appearance and magnitude (Figs. 5, 7a).
-
New events,western Tibet
Nearly all (> 85%) traces for the deeper events WT1 (‘98 km’) and WT2 (‘78 km’) have Sn/Lg ≥ 2, even if their raypaths significantly overlap with the poor-Sn zone. In contrast, neither WT3 (‘58 km’) nor the three shallow comparison events (≤ 15 km) recorded Sn/Lg ≥ 2 for any stations within the poor-Sn zone, and all show < ∼70% traces with Sn/Lg ≥ 2 south of the poor-Sn zone (Figs. 6, S7-2) with both average and maximum values clearly below those for WT1 and WT2 (Fig. 7b). A clear distinction exists between the three shallow comparison events and events WT1 and 2. WT3 has Sn/Lg more similar to the shallow comparison events.
-
-
图片:
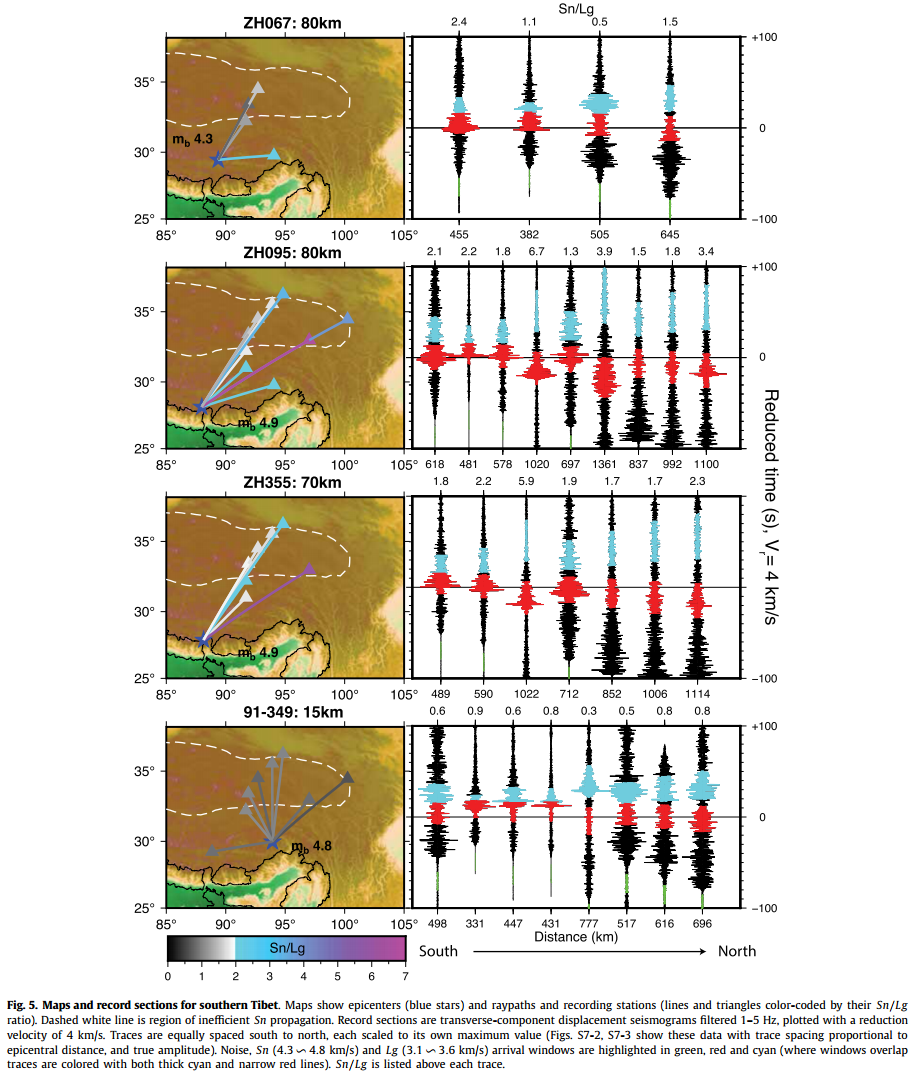
图片简介:Maps and record sections for southern Tibet. Maps show epicenters(震中) (blue stars) and raypaths and recording stations (lines and triangles color-coded by their Sn/Lg ratio). Dashed white line is region of inefficient Sn propagation. Record sections are transverse-component displacement seismograms filtered 1–5 Hz, plotted with a reduction velocity of 4 km/s. Traces are equally spaced south to north, each scaled to its own maximum value (Figs. S7-2, S7-3 show these data with trace spacing proportional to epicentral distance, and true amplitude). Noise, Sn (4.3 4.8 km/s) and Lg (3.1 3.6 km/s) arrival windows are highlighted in green, red and cyan (where windows overlap traces are colored with both thick cyan and narrow red lines). Sn/Lg is listed above each trace.

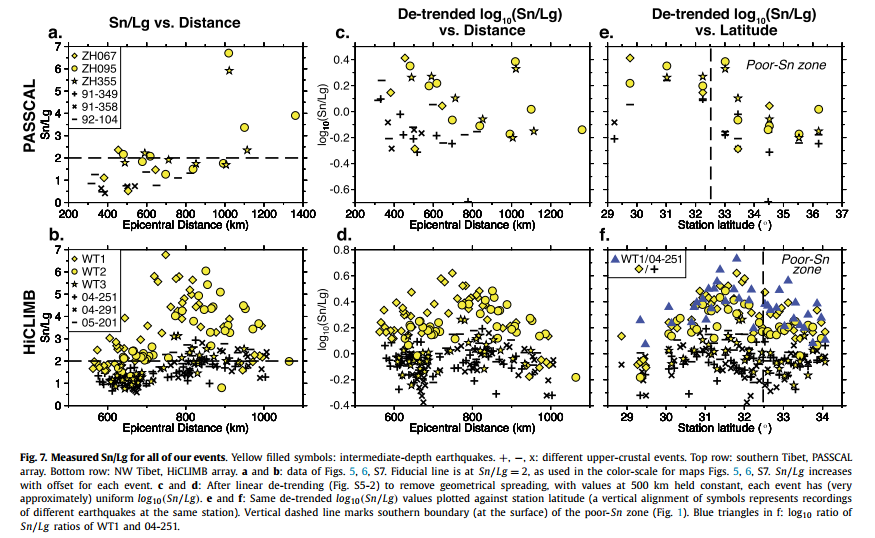
图片简介:Measured Sn/Lg for all of our events.
Yellow filled symbols: intermediate-depth(中深度地震) earthquakes.
+, −, x: different upper-crustal events.
Top row: southern Tibet, PASSCAL array.
Bottom row: NW Tibet, HiCLIMB array.
a and b: data of Figs. 5, 6, S7. Fiducial line is at Sn/Lg = 2, as used in the color-scale for maps Figs. 5, 6, S7. Sn/Lg increases with offset for each event.
c and d: After linear de-trending (Fig. S5-2) to remove geometrical spreading, with values at 500 km held constant, each event has (very approximately) uniform log10(Sn/Lg).
e and f: Same de-trended log10(Sn/Lg) values plotted against station latitude (a vertical alignment of symbols represents recordings of different earthquakes at the same station).
Vertical dashed line marks southern boundary (at the surface) of the poor-Sn zone (Fig. 1).
Blue triangles in f: log10 ratio of Sn/Lg ratios of WT1 and 04-251.
6.Possible complicating amplitude effects
-
总结:
-
Large lateral attenuation(衰减) variations have little effect on our qualitative discriminant
-
1D-theoretical site effects are irrelevant to Sn/Lg
-
Lg and Sn blockage(堵塞) and leakage(泄露) due to significant Moho topography has mostly been studied across continental margins.We have avoided this complication by only studying events and stations that lie on the Tibetan Plateau that has relatively uniform crustal thickness. We also avoided the Hindu Kush subduction zone because subducting plates significantly disrupt both Sn and Lg waveguides (Furumura and Kennett, 1998).
-
In the unusual case that the mantle lid has decreasing velocity with depth even after earth-flattening (e.g. Helmberger, 1972), the Sn waveguide is inactivated but the Sa waveguide is unaffected (Supplementary Materials S10), suggesting that our discriminant will still work.
-
7.Interpretations
-
总结:
Analyzing these events.
-
图片:
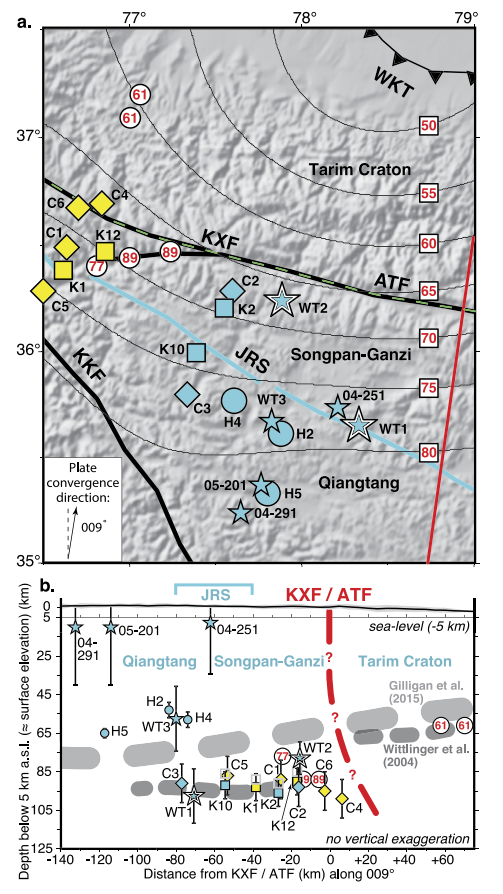
图片简介:Earthquake locations and depths, northwest Tibet.
a. Six earthquakes from this study (purple stars: Table 1) and 13 from previous studies (diamonds, squares, circles: Table S1; purple: SE group, yellow: NW group). Red numbers: Moho depths below 5-km-above-sea-level (a.s.l.) (≈ surface) (Gilligan et al, 2015; we added 5 km to their published values that were cited b.s.l.); in squares: 5-km contours east of 76.5◦E; in circles: single-station joint surface-wave/receiver-function inversion Moho depths. Red line: cross-section of Wittlinger et al (2004). Plate convergence direction from Bettinelli et al (2006). Green dashed line: strand of KXF used to measure earthquake distance in b.
b. Earthquakes (symbols as in a) plotted by distance from the KXF collapsed perpendicular to plate-convergence direction onto a true-scale cross-section (same scale as map) striking 009◦. Depth scale plotted below +5 km a.s.l. Mean elevation (black line) and gray envelope of min. and max. values calculated perpendicular to cross-section over central 140 km of KXF-ATF.For events prefixed ‘K’, we plot depths of Chen and Yang (2004) (solid squares) and of Priestley et al (2008) (open gray squares). Thick light-gray dashed line is Gilligan et al (2015) smoothed Moho, spanning ± 5 km to capture contour variability across 009◦ strike-direction. Less-thick darker-gray dashed line is Moho from Wittlinger et al (2004, their figure 4c). Red numbers/white circles (Moho depths) are plotted vertically below stations of Wittlinger et al (2004) but represent average of P s conversions spanning > 50 km laterally. Dashed red line: inferred geometry of KXF/ATF honoring Wittlinger et al (2004) receiver-function image and also placing all deep hypocenters in Indian cratonic mantle
8.Conclusion
-
总结:
We demonstrated a new method based on Sn/Lg amplitude ratios to recognize continental mantle earthquakes using an intrinsic(本质的) and prominent waveform feature of each individual earthquake.Our analysis relies on array measurements rather than individual Sn/Lg values,so is dependent on the availability of regional data.
We have shown the effectiveness of our method using theory, synthetics, and real data from earthquakes on the Tibetan plateau. Our theory and synthetics, based only on Love-wave normal modes, cannot address all aspects of real data, but do let us isolate and investigate many effects on which observed Sn/Lg depends. We have shown that for a specific region (here, Tibet) it is possible to set a sufficiently(充分的) high Sn/Lg threshold that is only exceeded by mantle earthquakes. Such a threshold is arbitrary(任意的): doubling our threshold would not change our identification of previously unidentified mantle earthquakes in western Tibet, though would mis-identify one of the southern-Tibet mantle earthquakes (ZH067) as crustal. Our simple approach allows almost complete disregard for all but the most prominent geologic features, such as the poor-Sn zone, or the boundaries of the Plateau.
Future studies may remain qualitative, using our Sn/Lg discriminant in regional context with multiple stations recording multiple earthquakes selected using catalog depths and geologic setting. However, more quantitative study is also warranted using 2D and 3D synthetics to quantify more possible effects on seismic waveforms, particularly those involving the interaction of Sn and Lg with sharp Moho topography
重要引用

简介:也许有详细介绍Sn和Lg波的重要性?